IS8002CDV 經典資料波形顯示軟體
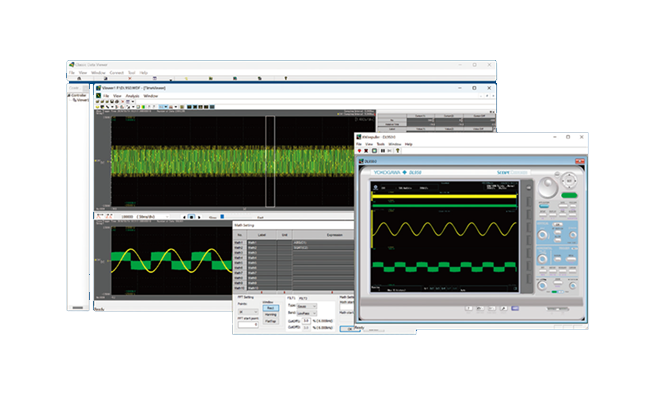
Main and Zoom Displays
Xviewer's zoom function works in the same manner as that on the DL instruments; displaying the entire waveform and a zoomed subset of the waveform simultaneously. The waveform can be horizontally and vertically zoomed. Even large amounts of waveform data (More than 2GP with the DL950) can be viewed quickly. The zoom window can be automatically scrolled (with variable direction and speed).

Annotation
Comments can be added as needed, in any position, on the waveform viewer window. All comments, plus the waveform(s) can be printed as displayed.

History memory display
Using the DL series instrument's history memory, you can arrange and display thumbnails of multiple acquired waveforms. The selected waveforms are expanded and displayed in the Main screen; multiple waveforms can also be superimposed.

Cursors
Using cursors, you can display the measured values at the points where the cursors intersect the waveform. There are three types of cursors available: horizontal, vertical, and X-Y. If two cursors are displayed, the difference between the them can be calculated and displayed.

Waveform computation (available only with Math Edition)
Up to 32 math waveforms based on the displayed waveform data can be calculated and displayed. In addition to simple addition, subtraction, multiplication, and division, user-defined equations can be created using a large number of functions including: trigonometry, differentiation/integration, pulse width computation, and six types of FFT calculations. FFT analysis using up to 2M data points can be performed, and a wide variety of functions are available for frequency domain calculations such as power spectrum and transfer functions (amplitude and phase). Digital filtering (low pass, high pass, band pass) calculations for noise rejection and other applications are also included.

FFT Display
Frequency domain waveforms are displayed in a dedicated FFT viewer window.

Automated waveform parameter measurements
Parameters (characteristics) of the displayed waveforms can be automatically calculated and displayed. Up to twenty-six parameters can be selected. Calculation of the selected parameters is performed automatically and the measured results are displayed in a list (as shown on the left).
The results of these calculations can be saved in a CSV file.
Cycle Statistics and History Statistics functions, which are both available in DL series instruments, can also be available in Xviewer when the software version is 1.70 or later. A histogram of statistical result(s) can be displayed as well. The statistical result(s) can be saved in a .csv file.

Main specifications
| Compatible instruments (Remote control of the DL series, Waveform Viewer) | DL950*1*2, DL350, DLM5000HD, DLM5000, DLM3000HD*2, DLM3000, other DL/DLM series, SL1000, and each series of the above models | |
| PC System Requirements | PC capable of running Windows 10/Windows 11, Intel Core i5-10210U or later Intel CPU with 4 or more cores (8 or more threads), 4.2 GHz or faster, 4 GB or more memory | |
| Display Resolution | 1366 x 768 dots or higher, 100% zoom | |
| Supported File types | Binary format (*.wvf, *.wdf) ASCII format (*.csv) MATLAB format saved by DL950, DL850 series and DL350 (*.mat) MATLAB format saved by this software (*.mat) |
|
| Max. Number of displayed waveforms | 90/Group, Up to 10 Groups can be set | |
| Display format | Main, Zoom, History, X-Y | |
| Number of divided Windows | Max. 16 | |
| Cursors | Vertical, Horizontal and X-Y | |
| Annotation | Comments can be added in the Main, Zoom and X-Y windows | |
| Automated Calculation of Waveform Parameters | 28 parameters such as P-P, Amp, RMS and Freq. Cycle Statistics and History Statistics. | |
| Save file format | Waveform data file (*.wdf, *.wvf, *.csv, *.xls, *.fld, *.mat) Screenshot file (Clipboard, *.bmp, *.png) Waveform parameters automatically calculated (*.csv) Display settings (*.csv) |
|
| Waveform displayed | ||
| Waveform Data Conversion | Waveform data files (*.wvf, *.wdf) can be converted to *.csv Waveform data files (*.wdf) can be converted to *.wvf Waveform data files (*.wvf, *.wdf) can be converted to *.fld |
|
| Waveform Computation (available only with the Math option) | Max. Number of displayed waveforms (CHs) | 32 waveforms (Math1 to Math32) |
| Computation Accuracy (resolution) | Single floating point number | |
| Operations | +, -, x, /, Phase Shift, ABS, SQRT, LOG, EXP, RMS, NEG, SIN, COS, TAN, ATAN, PH, DIF, DDIF, INTG, IINTG, BIN, P2, P3, F1, F2, FV, PWHH, PWHL, PWLH, PWLL, PWXX, DUTYH, DUTYL, FILT1, FILT2, HLBT, MEAN, LS, RS, PS, PSD, CS, TF, CH | |
| FFT Points | Max. 2 M points | |
| FFT Window | Rect, Hanning and Flat top | |
| Digital Filter | Gauss, Sharp, IIR | |
| Max. Number of computed points | 12.5 M points (depends on the number of Math channels) | |
*1 When opening data files with specific sample rate combinations of the multi-sample rates feature, some channels may not load.
*2 Will be supported by the future update.